Understanding market behavior is both an art and a science. For anyone interested in technical analysis, chart patterns are invaluable tools for interpreting price movements. Among these, the descending triangle often emerges as a critical formation, offering traders and analysts clues about potential market direction. While it shares some visual similarities with other patterns, such as falling wedges, its implications can differ significantly.
What Is a Descending Triangle?
A descending triangle is a bearish continuation pattern characterized by a series of lower highs converging toward a flat support level. Picture a triangle that slopes downward from left to right, with the bottom edge acting as a horizontal floor. This structure reflects a market where sellers gradually gain strength, putting pressure on buyers.
Unlike symmetrical triangles, where buyers and sellers are evenly matched, descending triangles signal that sellers are likely to dominate, often leading to a breakdown below the support level. However, context is essential—patterns can behave differently depending on the broader market environment.
Falling Triangles vs Descending Wedges: The Visual Distinction
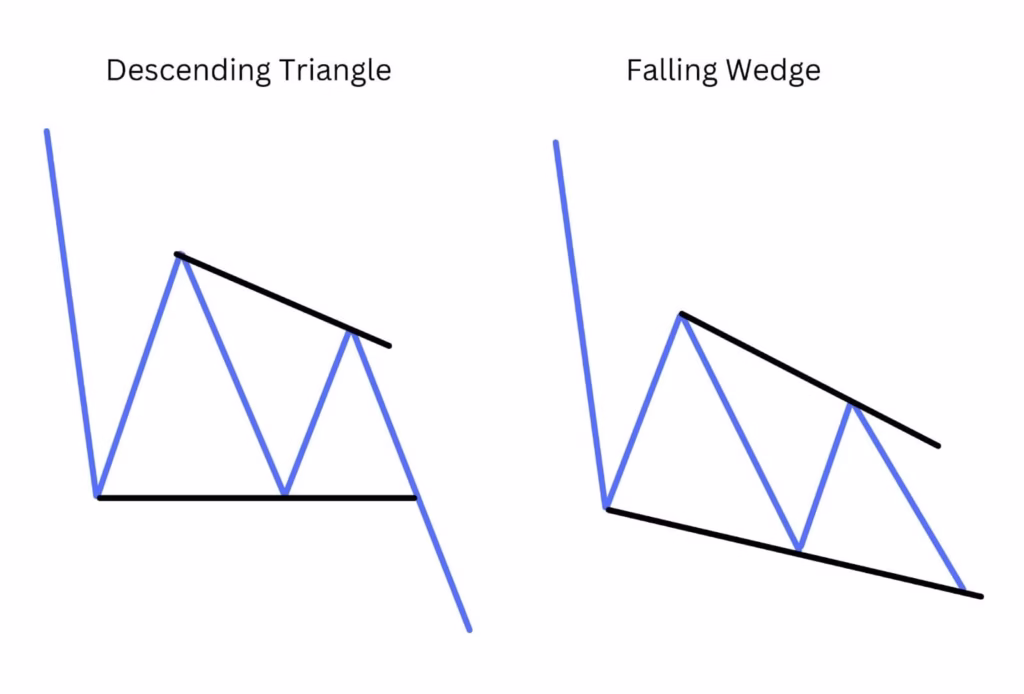
At first glance, falling triangles and descending wedges might appear similar because both slope downward. But a closer inspection reveals subtle yet crucial differences.
● Falling Triangles: These formations typically feature a flat or nearly horizontal support line with declining highs. The slope of the triangle indicates persistent selling pressure, making it a predominantly bearish signal.
● Descending Wedges: In contrast, descending wedges have both the upper and lower trendlines sloping downward. The narrowing structure implies weakening momentum among sellers, often foreshadowing a bullish reversal rather than a continuation of a downtrend.
Understanding these distinctions is vital. Misidentifying a descending wedge as a descending triangle could lead to incorrect assumptions about potential market moves.
The Psychology Behind Descending Triangles
Market patterns are not just shapes on a chart—they reflect collective trader psychology. In a descending triangle, the series of lower highs demonstrates that sellers are becoming more aggressive, testing buyers repeatedly. Each failed attempt to push prices higher signals growing pessimism.
Meanwhile, the horizontal support line indicates a price level where buyers are stepping in consistently. The tension between sellers and buyers often reaches a tipping point, culminating in a decisive breakout—usually downward in the case of a true descending triangle.
Key Technical Characteristics
To identify a descending triangle accurately, consider these factors:
1. Trendlines: The upper trendline must slope downward, while the lower trendline should remain relatively flat.
2. Volume: Trading volume often contracts during the formation and spikes upon breakout, confirming the pattern.
3. Duration: Descending triangles can appear over different timeframes, from intraday charts to weekly charts, and their reliability may vary accordingly.
4. Breakout Direction: The pattern is typically bearish, but external market conditions should always be considered to avoid false signals.
Falling Wedges: A Bullish Twist
Where descending triangles suggest selling dominance, falling wedges offer a contrasting message. Both trendlines slope downward, but the narrowing wedge shows diminishing selling pressure. Buyers may gradually gain confidence, leading to an upward breakout.
Recognizing this difference is essential for technical analysts seeking to forecast market behavior accurately. By studying historical price action and confirming with other indicators, analysts can distinguish between continuation patterns and reversal patterns with greater precision.
Applying These Patterns in Modern Market Analysis
How do descending triangles and falling wedges influence contemporary market strategies? Today’s markets are heavily data-driven, and combining chart pattern recognition with other analytical tools enhances predictive accuracy.
● Support and Resistance Testing: Patterns often coincide with key support and resistance zones. A descending triangle’s flat support line may align with historical lows, strengthening the pattern’s validity.
● Volume Analysis: Monitoring volume trends during the formation and breakout phases can help analysts distinguish genuine signals from false ones.
● Contextual Indicators: Incorporating moving averages, relative strength index (RSI), and Fibonacci retracement levels can provide a more holistic view of potential price behavior.
Common Mistakes in Pattern Interpretation
Even seasoned analysts can misread descending triangles and wedges. Here are frequent pitfalls:
● Ignoring Trend Context: Patterns are more reliable when viewed within the broader market trend. A descending triangle in a bullish market may not behave as typically expected.
● Overreliance on Shape Alone: While visual recognition is important, supporting indicators and volume analysis are critical for confirmation.
● Confusing Wedges and Triangles: Misclassification can lead to incorrect expectations regarding breakout direction.
Practical Examples from Market History
Historical charts provide concrete lessons. For instance, in stock indices and commodities markets, descending triangles have often preceded sharp downward moves. Conversely, descending wedges in the same sectors have signaled rebounds following prolonged declines. Observing these patterns across multiple timeframes enhances pattern recognition skills and informs more confident analysis.
How Analysts Use Patterns Without Direct Market Engagement
Notably, studying descending triangles and wedges doesn’t require participation in buying or selling. Analysts, educators, and market strategists can leverage these patterns to:
● Forecast potential price movements for research purposes
● Enhance educational content, such as in an Elliott Wave course
● Refine algorithms for pattern recognition and predictive analytics
This approach underscores that understanding market patterns is both practical and academic, benefiting professionals who focus on strategy and analysis rather than direct transactions.
Conclusion
Differentiating between falling triangles and descending wedges is not just about identifying shapes on a chart; it’s about decoding the underlying market psychology. Descending triangles suggest selling dominance and potential downward breakouts, while descending wedges hint at weakening selling pressure and bullish reversals. By combining visual analysis with volume data, trend context, and complementary techniques, analysts can achieve deeper insights into price behavior.
For those looking to enhance their pattern recognition skills further, leveraging expert SEO insights and market research from platforms like Alchemy Markets can provide valuable, actionable content for education and analysis purposes, seamlessly connecting technical knowledge with practical applications.
FAQs About Descending Triangles and Wedges
What differentiates a descending triangle from a falling wedge?
A descending triangle has a flat support line with descending highs, typically signaling a bearish continuation. A falling wedge has both trendlines sloping downward, suggesting weakening selling pressure and a potential bullish reversal.
Can these patterns fail to predict price movements?
Yes. No pattern guarantees outcomes. False breakouts occur, especially when broader market forces or unexpected news override historical tendencies. Volume and trend context are key to reducing errors.
Is an Elliott Wave course useful for understanding these patterns?
Absolutely. Elliott Wave theory complements pattern recognition by providing a framework for interpreting market psychology and wave structures, which can clarify the implications of triangles, wedges, and other formations.
Do descending triangles only occur in bearish markets?
While they are more common in downtrends, descending triangles can appear in any market. Their interpretation must consider the overall market context to avoid misreading signals.