Factories have no shortage of signals. What they often lack is a repeatable way to move raw signals into decisions. That is where industrial DataOps comes in. Think of it as the engineering discipline that treats data like a product. It sets clear contracts, tests, and release processes so analytics and apps never guess what the data means.
The goal is simple. Cut latency from event to insight. Raise trust in every number on the screen. Deliver consistent data analytics for manufacturing that teams can use during the shift, not after it.
Data sources in manufacturing: OT + IT convergence
Operational tech and business systems speak in different rhythms. Your pipeline must reconcile both without losing fidelity.
| Source type | Examples | Cadence | Owner | Common issues | What good looks like |
| OT signals | PLC tags, SCADA events, CNC logs, vibration, temperature, vision frames | Milliseconds to seconds | Plant engineering | Tag changes, time drift, packet loss, noisy sensors | Time-synced ingestion, late-event handling, calibrated sensors |
| Edge files | Historians, machine CSVs, camera frames, quality PDFs | Seconds to minutes | Maintenance, quality | File drops, schema drift, partial writes | Atomic staging, schema registry, checksum validation |
| IT systems | ERP, MES, WMS, CMMS, QMS | Minutes to hours | IT, ops planning | Batch delays, slow joins, missing keys | CDC or event sourcing, conformed IDs, SCD management |
| External context | Weather, energy price, supplier status | Minutes to daily | Ops excellence | Unreliable APIs, unit mismatches | Rate limiting, unit standardization, caching |
Two phrases you will hear often here are manufacturing data pipelines and smart factory analytics. The first is the plumbing. The second is the value on top. Keep them coupled by contracts, not custom code.
Principles of DataOps in manufacturing
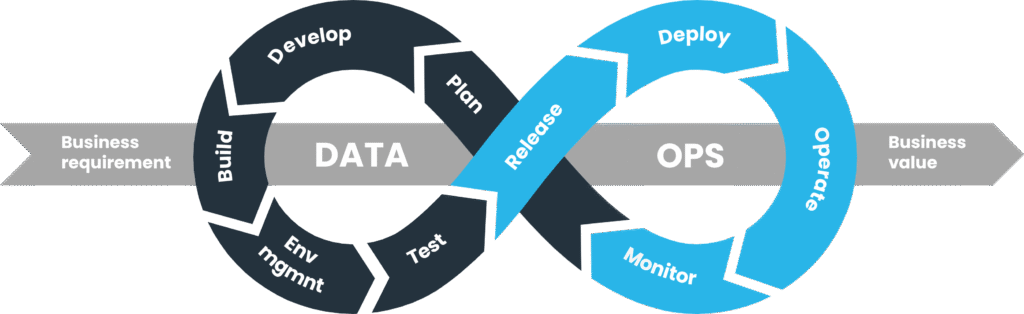
Just as DevOps revolutionized software delivery, DataOps brings discipline to data engineering. For manufacturing, this means:
· Version Control: Every pipeline, schema, and rule is tracked, so teams know which version is running.
· Continuous Integration: Automated checks for schema consistency, data quality, and latency.
· Continuous Deployment: Rollouts that can be staged across plants with rollback safety.
· Observability: Monitoring latency, error rates, and data freshness to ensure reliable data analytics for manufacturing.
By embedding these principles, industrial DataOps reduces surprises and improves trust in analytics across production sites.
Building resilient pipelines for sensor and ERP data
Manufacturing data pipelines must survive plant realities: sensor failures, network lag, and schema changes. Resiliency is non-negotiable.
Best practices include:
· Using message brokers to stream OT signals in real time.
· Applying schema registries to handle changes gracefully.
· Storing data in layered zones: raw (bronze), cleaned (silver), and analytics-ready (gold).
· Testing for data drift, missing fields, or unit mismatches before publishing to gold.
For example, a temperature sensor stream can first be validated for unit consistency (°C vs °F), aligned with ERP work orders, and then published as a gold dataset for process optimization. This layered approach keeps pipelines stable and auditable.
Scalable cloud architecture for real-time analytics
Scaling beyond one line or one plant requires a cloud-first architecture. A hybrid model often works best for manufacturers, where sensitive workloads remain on-prem while heavy analytics move to the cloud. This makes data management services very essential to handle ERP data, sensor streams, and legacy systems during pipeline rollouts.
Typical architecture layers:
· Edge: Local buffering, protocol translation, filtering.
· Transport: Managed message brokers for streaming events.
· Data Lake/Warehouse: Central store with bronze, silver, and gold layers.
· Processing Engine: Stream and batch frameworks for ETL, aggregations, and model scoring.
· Serving Layer: APIs, BI dashboards, and real-time monitoring apps.
This setup supports both batch analytics for long-term planning and low-latency queries for smart factory analytics like predictive maintenance.
Enabling production optimization and downtime prediction
Scalable pipelines are not just about moving data efficiently. They must deliver outcomes that operations teams value.
Example 1: Changeover Optimization
· Problem: Long delays during machine setup.
· Pipeline: Real-time checks compare live machine parameters with recipe data in ERP.
· Outcome: Faster setup and fewer errors.
Example 2: Predictive Maintenance
· Problem: Bearing failures leading to unplanned downtime.
· Pipeline: Vibration and temperature data is processed into health scores.
· Outcome: Early alerts give maintenance teams time to act.
Both cases highlight how data analytics for manufacturing shifts from hindsight reporting to real-time action.
Practical rollout plan
Scaling across plants can feel daunting, so start small.
Suggested 12-week pilot:
· Weeks 1–2: Define contracts for 10 key tags and ERP tables.
· Weeks 3–4: Build raw-to-clean layers with validation checks.
· Weeks 5–6: Publish analytics-ready datasets for OEE or downtime.
· Weeks 7–8: Add a real-time rule (e.g., recipe mismatch alert).
· Weeks 9–12: Deploy one predictive model into the pipeline.
Once trust builds in one pilot line, the same patterns can extend to more equipment, more plants, and broader smart factory analytics initiatives.
Common pitfalls to avoid
· Schema drift: Fix with registry checks and clear deprecation rules.
· One-off dashboards: Standardize marts so every team uses the same definitions.
· Ignoring data ownership: Assign a human owner for every dataset or tag.
· Overdoing real-time: Use streaming only where fast decisions are required; batch remains efficient for many cases.
Measuring success of manufacturing data pipelines
Building a scalable pipeline is only half the story. The other half is knowing whether it delivers business value. Manufacturers need clear benchmarks to judge the effectiveness of their manufacturing data pipelines beyond uptime or storage costs.
Key success measures include:
· Latency: Time taken from sensor event to insight delivery. In high-speed production, even a 5–10 second delay can reduce decision accuracy.
· Data quality: Percentage of records passing schema, range, and completeness checks. Poor quality undermines trust in data analytics for manufacturing.
· Adoption rate: How often operations and engineering teams rely on pipeline-driven insights during their shift. A pipeline unused by its intended audience fails in its purpose.
· Downtime impact: Reduction in unplanned equipment stoppages when predictive signals are acted upon.
· Cost efficiency: Comparing storage, compute, and maintenance costs to measurable improvements in production or quality metrics.
Instead of chasing vanity metrics like terabytes ingested, focus on KPIs that align with plant priorities. When pipelines directly reduce downtime, improve yield, or speed up changeovers, they prove their worth. This approach helps factories scale smart factory analytics with confidence, knowing the pipelines are not just technically sound but operationally impactful.
Conclusion
Data has always been present in factories, but without discipline, it becomes noise. By applying industrial DataOps and building pipelines that are resilient, governed, and scalable, manufacturers can make their data reliable and actionable.
The reward is not just more dashboards but better daily decisions. With structured pipelines, factories can run data analytics for manufacturing that improve uptime, cut waste, and drive smarter planning. In a world where every minute of downtime matters, scalable pipelines are the real foundation of the smart factory.