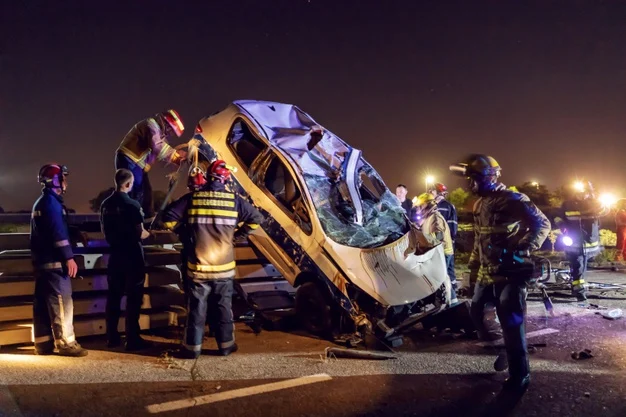
St. Petersburg sees roughly five thousand traffic crashes annually. That’s roughly fourteen crashes every single day across a relatively compact city. Some neighborhoods concentrate accidents far more than others. Knowing where crashes cluster helps drivers stay alert and take extra precautions in danger zones. Understanding the patterns transforms abstract statistics into actionable awareness. You can’t avoid all risk, but you can avoid the highest-risk areas or navigate them more carefully.
Why knowing where crashes cluster helps drivers stay alert comes down to pattern recognition. Certain intersections have repeated crashes for reasons. Bad sight lines, confusing signals, aggressive traffic patterns, pedestrian density. These factors create predictable collision hotspots. Drivers aware of these locations approach them differently. They reduce speed, increase following distance, and stay extra focused. That awareness prevents accidents.
Learning insights drawn from St. Petersburg car accident statistics and what they reveal about city driving patterns transforms raw numbers into protective knowledge, which means understanding St. Petersburg car accident statistics helps you navigate safely.
What the Numbers Reveal
Most frequent crash zones concentrate in downtown corridors, at major intersections like Central Avenue and Fourth Street, and on highway merge zones like I-275 access ramps. These locations combine high traffic volume with infrastructure or behavioral factors that create risk. Downtown sees crashes during rush hours when congestion is highest. Highway merges see crashes when drivers miscalculate gaps or fail to signal lane changes.
Patterns by time of day show rush hours from seven to nine AM and four to seven PM as peak crash windows. Weekend nights see increased crashes involving alcohol. Afternoon periods see higher pedestrian-involved crashes. Weather patterns shift accident locations. Rain increases crashes at intersections with poor drainage. Heat doesn’t cause crashes directly, but it correlates with driver fatigue and reduced focus.
Local trends compared with state averages show St. Petersburg at or slightly above Florida’s crash rate. Some neighborhoods perform better than state average. Others significantly exceed it. That variation matters because it shows that local factors drive crash rates, not just random bad luck or universal Florida problems.
Why Certain Areas See More Accidents
Road design, congestion, and distractions combine to create accident zones. Roads designed without adequate warning for sharp turns see repeated crashes at those curves. Areas with heavy congestion create stress that leads to aggressive driving and mistakes. High-distraction zones like commercial corridors with many signs, signals, and activity overwhelm drivers.
Pedestrian and cyclist density increases accident risk dramatically. Downtown St. Petersburg has high foot traffic and bike commuting. These areas see crashes involving vulnerable users. Schools and parks create similar hotspots. Tourist routes like those to the pier concentrate unfamiliar drivers making navigation decisions while paying attention to scenery rather than traffic.
The Role of Driver Behavior
Speeding, red-light running, and tailgating appear in crash reports consistently. Drivers exceeding safe speeds lose control or can’t stop in time. Running red lights creates intersection collisions. Tailgating removes safety margins. How small choices compound citywide risk is obvious when you realize that thousands of drivers making slightly worse choices daily creates exponentially more crashes.
Enforcement efforts targeting top violations include increased police presence at high-crash intersections, red-light cameras in strategic locations, and community policing focused on speed enforcement in residential areas. These efforts work. Intersections with visible enforcement see reduced crash rates. The deterrent effect is real.
Turning Stats into Safer Streets
Infrastructure upgrades and public campaigns address specific hotspots. Improved traffic signals, better road markings, protected bike lanes, and pedestrian safety improvements all reduce crashes. Public awareness campaigns targeting distracted driving or speeding in high-crash areas create cultural pressure toward safer behavior.
Using data for personal route planning means avoiding known hotspots when possible. If Central and Fourth is consistently problematic, taking an alternate route during peak times adds minutes but significantly reduces crash risk. That trade-off is worth it.
City tech innovations including traffic sensors that optimize signal timing, cameras monitoring intersections for violations, and real-time traffic apps letting drivers choose safer routes all contribute to crash reduction. Investment in these systems reflects recognition that data-driven infrastructure saves lives.
Conclusion
How statistics highlight preventable danger means understanding that most crashes at these hotspots don’t have to happen. Better driving, better infrastructure, and better enforcement prevent them. The data shows what’s possible with focus and investment.
Urging awareness and responsibility means recognizing that you control your own driving choices even if you can’t control other drivers. Staying alert in known hotspots, reducing speed, and maintaining focus protect you.
Studying St. Petersburg car accident statistics can literally save your life by revealing where to exercise extra caution and which routes to avoid during peak times.


